We've noticed you haven't been active on the platform recently. We encourage
you to continue trading with confidence, as your account has been marked as
highly potential based on your trading activity.
Your best trade on 00.00.2022
Asset
Trades
Turnover
Profit
Winning
AUD/CHF
3
$30.00
+$23.10
100%
Here is how you can use chart patters to increase your profit👇
Chart patterns in trading are shapes or formations on a price chart
that
traders use to predict future price movements.
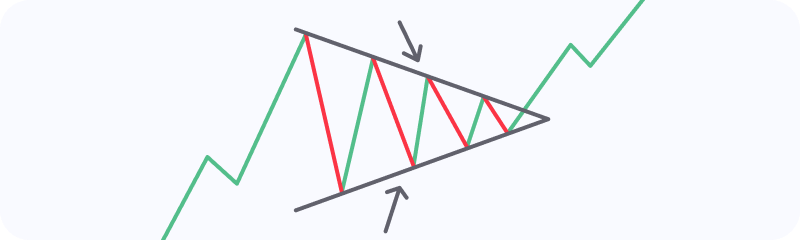
One of the most popular chart patterns is a Symmetrical Triangle. This pattern
has a shape of a 'symmetrical triangle', where the price is making lower highs
and higher lows. Connecting these points creates a triangle shape on the chart.
The breakout can
occur in either an
upward (bullish) or downward (bearish) direction. Depending on the breakout
direction, traders decide whether to buy (go long) or sell (go short).
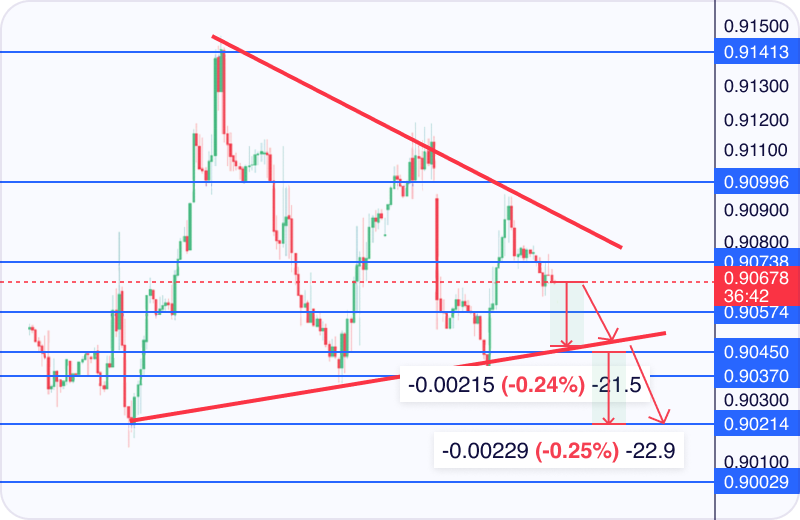
You may trade inside the pattern and after the breakdown, increasing profit
opportunities. The symmetrical triangle breakout usually equals the maximum
height of the pattern.
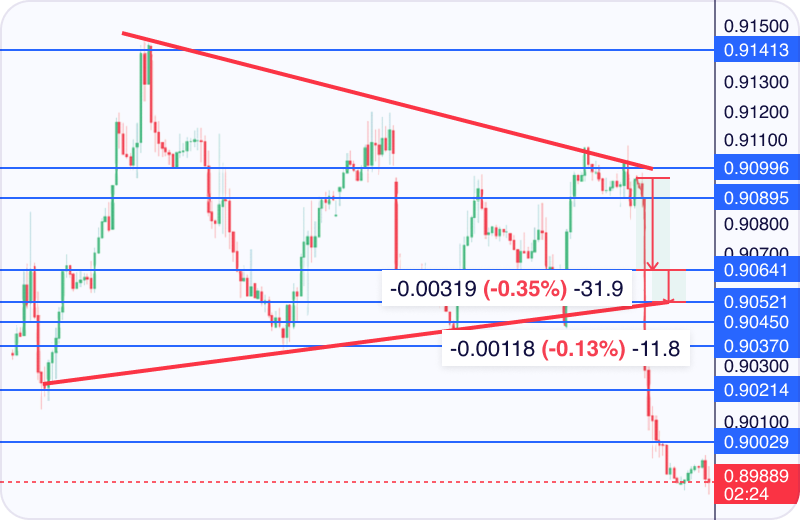
Example on USD/CHF (sell)👇
Forecast June 7, 2023
June 9, 2023
We are excited to see you succeed on our platform!
We remind you that you have been assigned a personal support manager to assist
you with any questions or concerns you may have, and to help you achieve your
trading goals.