Hello, {{Name}}!

We have noticed that recently you have been experiencing losses while trading. We`ve got you covered!
Follow these simple triangle tactics:

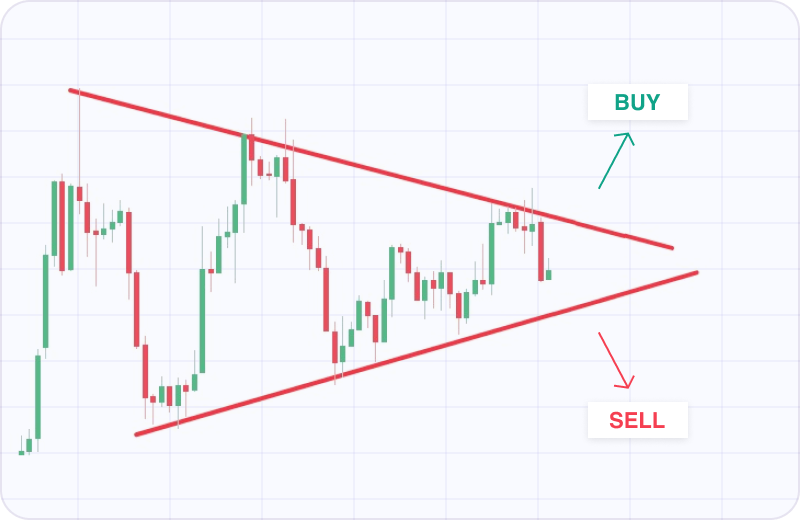
In trading, symmetrical triangles are chart patterns indicating a consolidation period before a price breakout. Formed by two converging trendlines with sequentially lower peaks and higher troughs, these patterns may end with bearish or bullish breakouts.

Gold (H4)

You may open a position following the breakout direction when you receive a breakout candle.
Unfortunately, sometimes there are fake breakdowns and the price returns to a triangle. In this case, there is nothing to do but close the deal with the loss and expect the following breakdown.
When the real breakout comes, you may follow the rupture direction and expect the asset to pass the same distance equal to the maximum height of the pattern.
The triangles may be found in all the timeframes.
Master this profitable trading pattern Using you Demo account and get back to trading with this PROMO CODE:
triangleprofit
Recieve +100% to your next deposit with this promo code!
⚠️ The offer will be valid for the next 24 hours!