|
|
Hey, {{Name}}, you definitely want to know this...
|
|
Ready to talk about something we've all been through? Yep, losses.
|
|
In this email, we're unwrapping an effective approach that can be your shield against
potential losses.🔥
|
|
Chart patterns are excellent instruments for forecasting price movements. of
the
most used chart patterns is the flags and pennants, which indicate the continuation
of
the price movement.
|
|
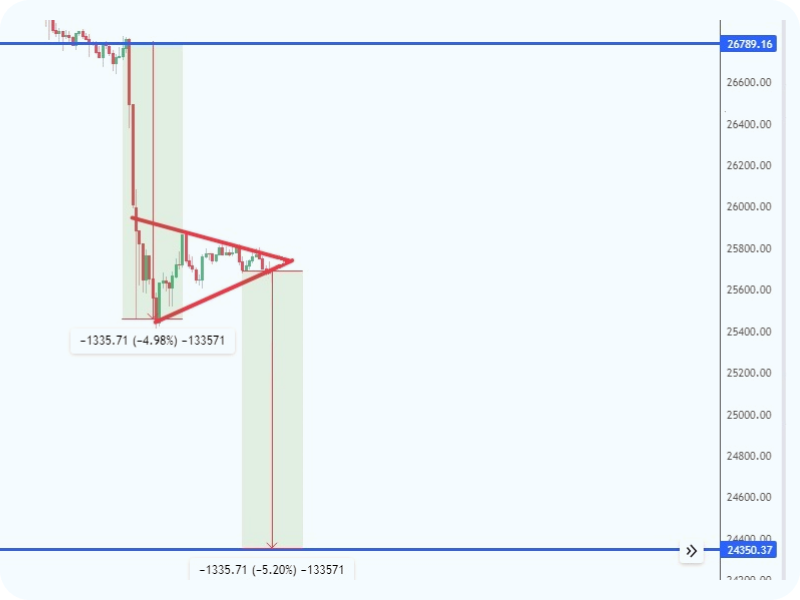
BTC/USD (M30)
|
|
|
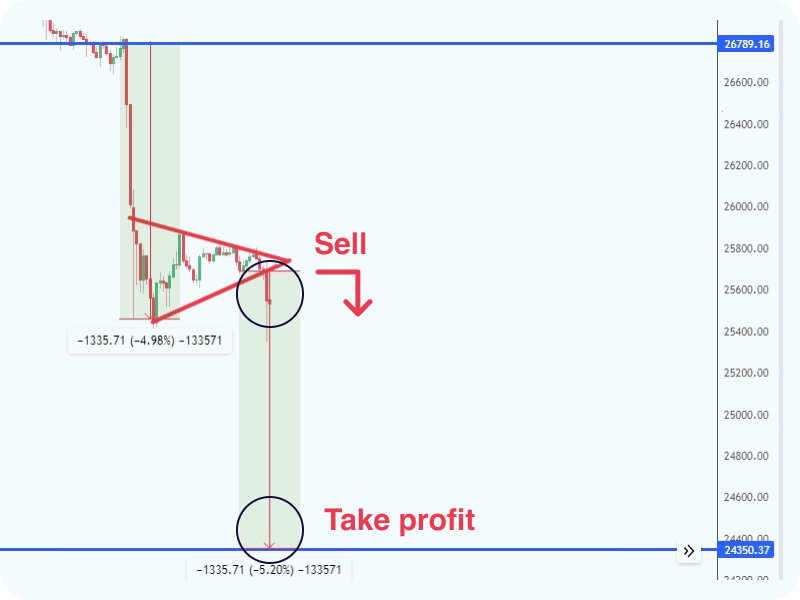
The flags and pennants are the pauses after the price jumps. After the breakout of the
critical level (depending on the price direction, they may be support or resistance
levels), a trader may expect the asset to pass the distance that equals the previous
movement. The target should be set before the next crucial level.
|
|
|
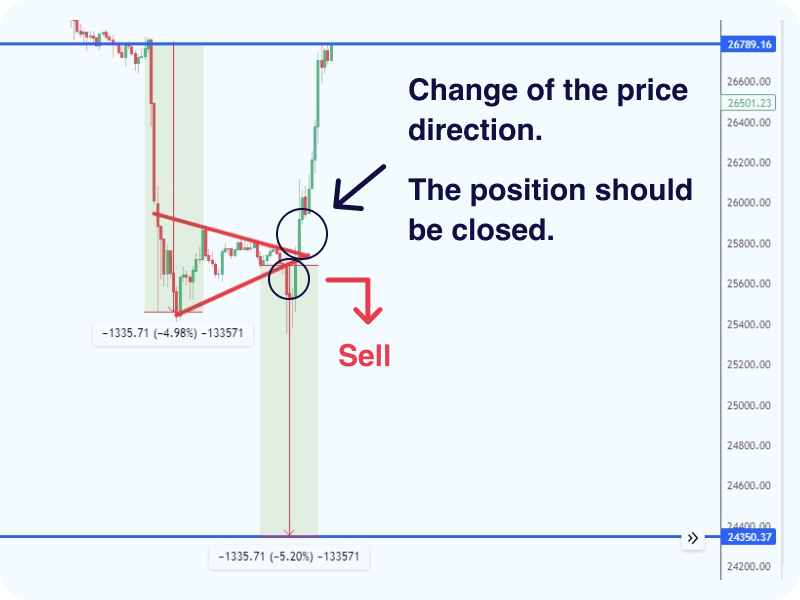
Nevertheless, the market is a live organism and doesn’t always follow the rules. The
news may change the direction of the price, and the trader will need to change the whole
strategy, reevaluating the situation. If the price comes inside the pattern, it means
that the pattern is not valid anymore, and it’s necessary to close the position even
with loss and look for other opportunities.
|
|
|
Want to practice this strategy with TOP traders?
|
|
Join their Live Sessions on
|

|

|
|
|
|
We teach how to become a successful
trader.
|

|
|
|
|