|
Hey, {{Name}}, you definitely want to know this...
|
|
Today, we want to chat about something that every trader encounters at some poinе -
how
to deal with losses. Losses can feel like a rollercoaster of emotions, but
they nothing
more than a natural part of trading and great learning opportunities.
|
|
In this email, we'll explore one strategy how to prevent losses:
|
|
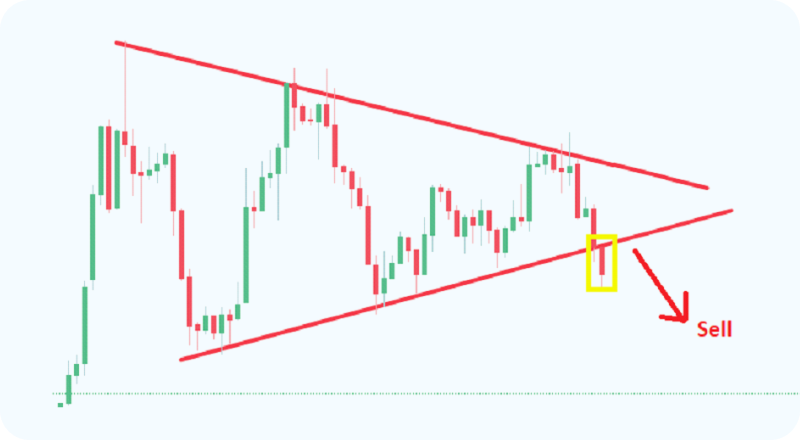
In trading, symmetrical triangles are chart patterns indicating a consolidation
period
before a price breakout. Formed by two converging trendlines with
sequentially lower
peaks and higher troughs, these patterns may end with bearish or bullish breakouts.
|
|
Gold (H4)
|

|
|
You may open a position following the breakout direction when you receive a breakout
|
|
|
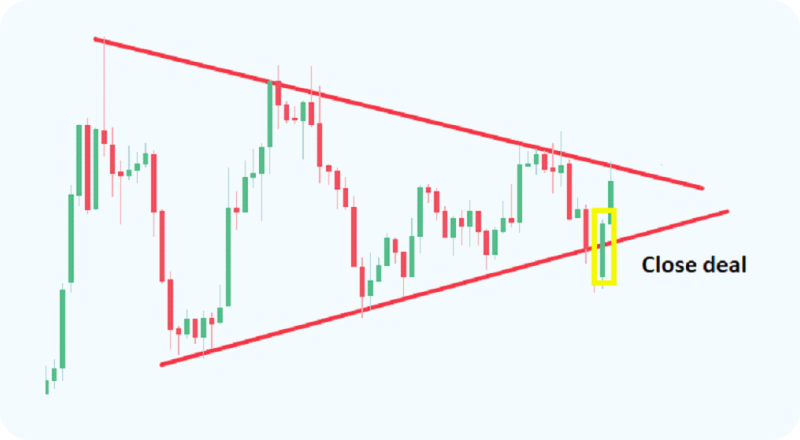
Unfortunately, sometimes there are fake breakdowns and the price returns to a triangle.
In this case, there is nothing to do but close the deal with the loss and expect the
following breakdown.
|
|
|
When the real breakout comes, you may follow the rupture direction and expect the asset
to pass the same distance equal to the maximum height of the pattern.
|

|
|
The triangles may be found in all the timeframes.
|
|
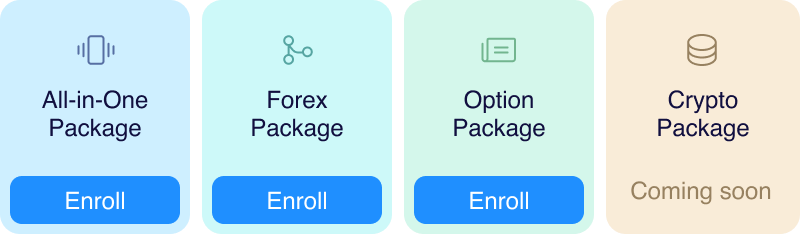
Want to know about more strategies that are the best when it comes to protecting
yourself from potential losses when trading?
|
|
Subscribe to one of the courses on
|

|

|
|
They provide clients with high-quality, comprehensive resources: video lessons, live
trading sessions and more to seize profitable opportunities in different financial
markets.
|
|