|
|
Hey, {{Name}}, you definitely want to know this...
|
|
👉 One of the best and most secure strategies to make money is provided by the trading
instrument divergence/convergence.
|
|
Divergence is when the price of an asset is moving in the opposite
direction of a technical indicator, such as an oscillator, or is moving contrary to
other data. Divergence warns that the current price trend may be weakening and, in some
cases, may lead to the price changing direction.
|
|
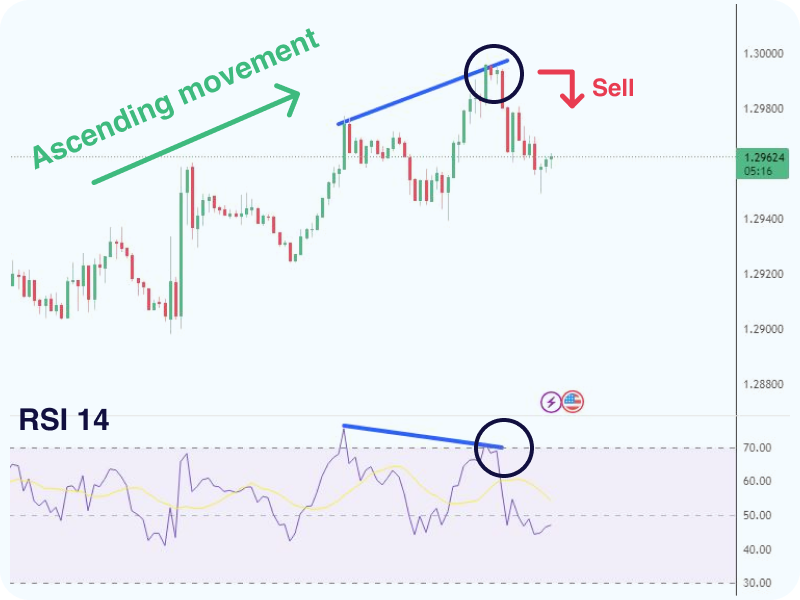
Divergence is when the price chart diverges with the used trading indicator. This looks
as follows: in an ascending movement, the price chart forms a new high that is higher
than the previous one, while the indicator shows a high that is no higher than the
previous one. This inequality might mean that the bulls are losing power, so the next
thing, a descending correction or even a reversal follows.
|
|
GBP/USD (M15)
|
|
|
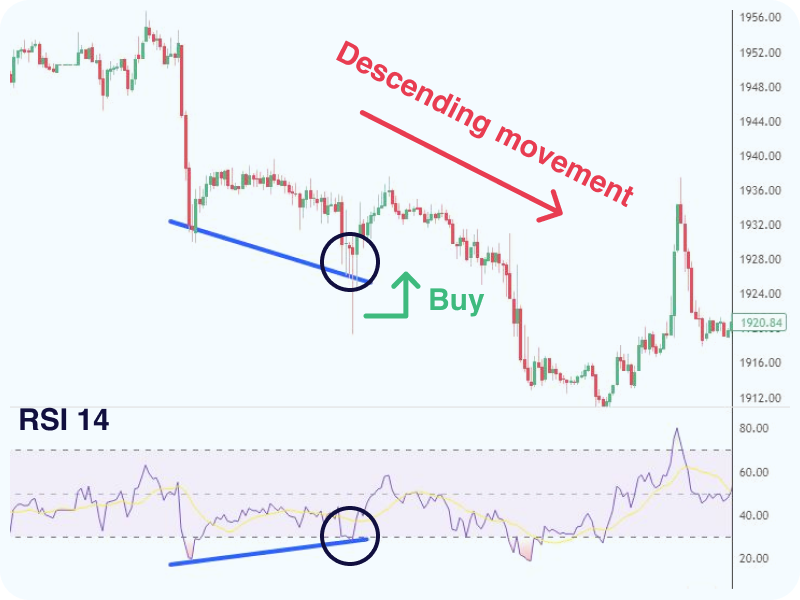
Convergence is when the price chart and the indicator chart converge.
This looks as
follows: in a descending movement, the price chart shows a new low, which is lower than
the previous one, while the indicator demonstrates a low higher than the previous one.
The indicator does not confirm the decline, which means the bears have become weaker, so
the next step: an ascending correction or reversal can follow.
|
|
XAU/USD (M30)
|
|
|
Want to know about more about indicators and additional tools to build your wealth?
|
|
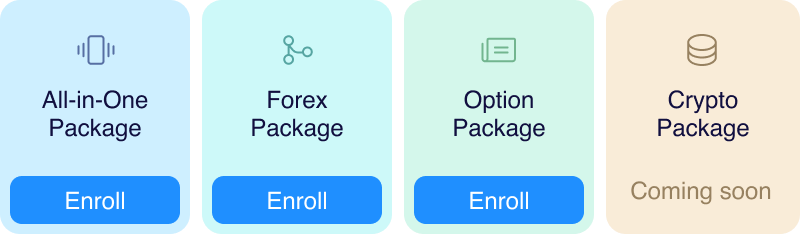
Subscribe to one of the courses on
|

|

|
|
They provide clients with high-quality, comprehensive resources: video lessons, live
trading sessions and more to seize profitable opportunities in different financial
markets.
|
|
|
Learn more about each
|
|
|
Become a successful trader and build your wealth!
|

|
|
|
|